Dashboard
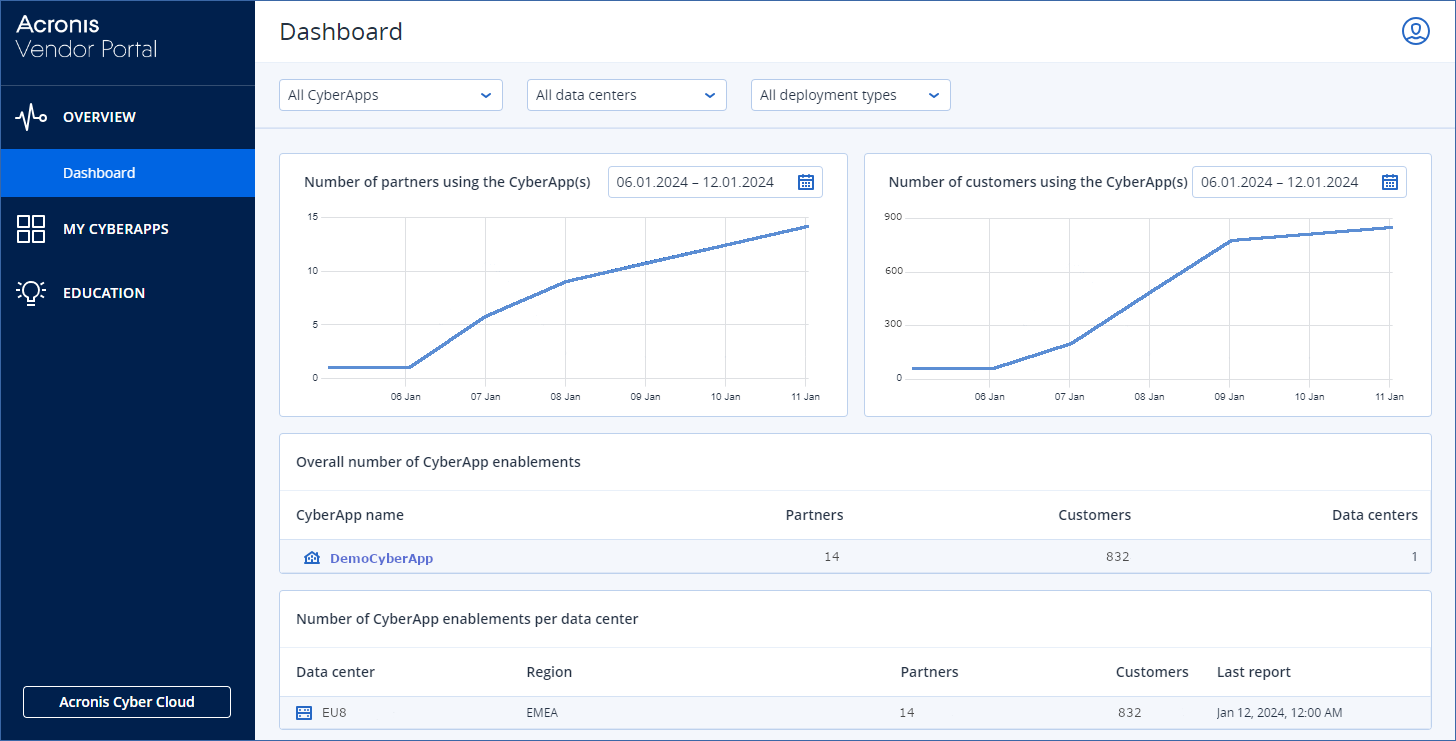
Dashboard displays CyberApp enablement and usage statistics by partner, end customer, and data center.
To open dashboard
Click
 in the Vendor Portal main menu.

Dashboard displays the following statistics:
Note
To change the date range statistics displayed by a graph, click the date range field and select your preference.You can select to display statistics from:
the past 7 days (default).
the past 30 days.
a custom date range.
Click the start date of your custom date range.
Click the end date of your custom date range.
Click < or > to select from a different month.Click << or >> to select from a different year.
Filtering dashboard
You can filter the displayed dashboard statistics by a combination of CyberApp, data center, and/or deployment type.
Note
The default filter is no filter. Dashboard displays statistics for all of your deployed CyberApps (test and production) on all data centers.
To apply a filter to dashboard, click a dropdown and select an option.