Dashboard
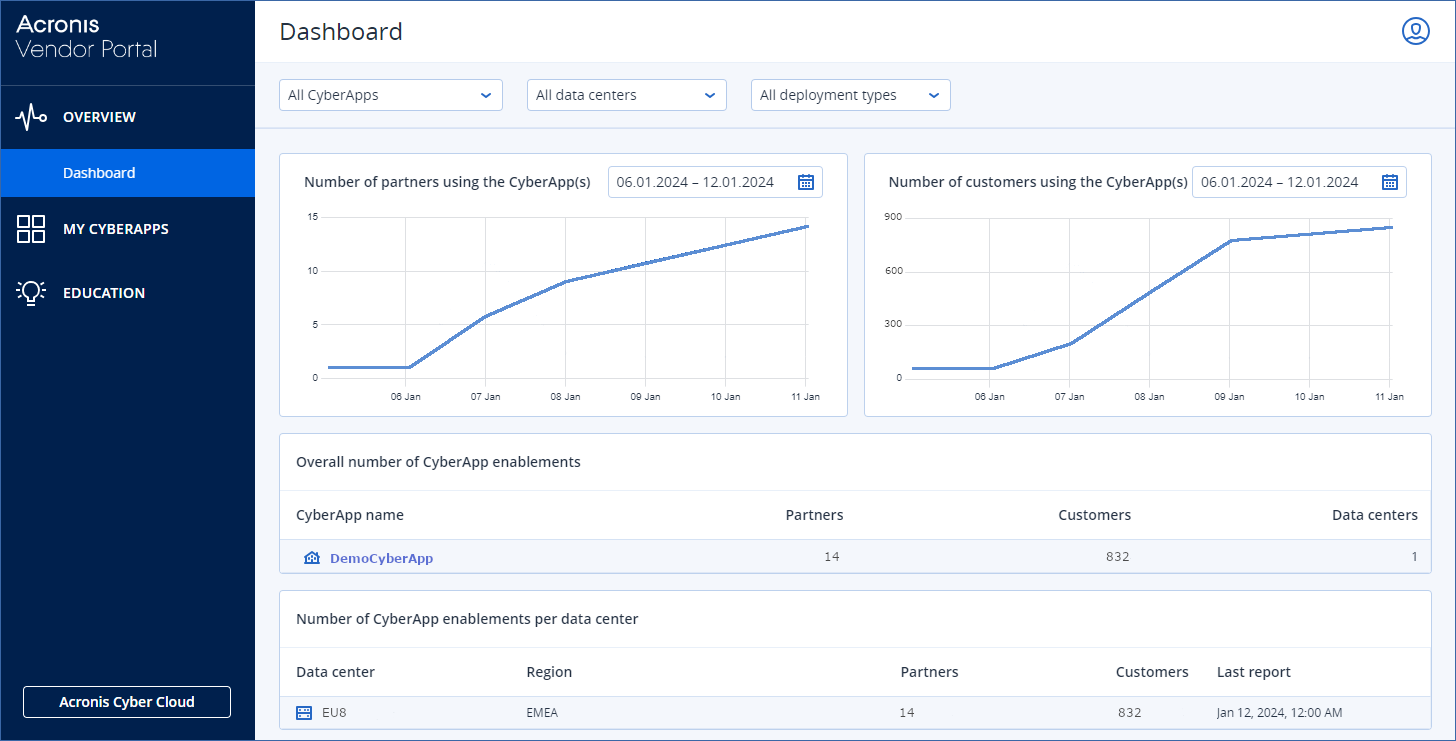
Dashboard displays your CyberApp enablement and usage data:
A graph of the number of partners using your CyberApps over a specified time period.
A graph of the number of customers using your CyberApps over a specified time period.
A list of the overall number of partners and customers who have enabled your CyberApps.
A list of the number of times the CyberApps have been enabled by partners and by customers on each of the data centers you have deployed to.
To open dashboard
Click
 in the Vendor Portal main menu.
- [Optional] Apply data filters by clicking a dropdown and selecting an option.You can filter the data by CyberApp, Acronis data center and/or deployment type (All deployment types, Production or Test environment).The defaults are All CyberApps, All data centers, and All deployment types.
- [Optional] Change the date range data displayed by a graph by clicking the graph’s date range field and selecting your preference.You can select to display data from:
The past 7 days (default).
The past 30 days.
A customized date range.
Click the start date of your custom date range.
Click the end date of your custom date range.
Note
Click < or > to select from a different month.Click << or >> to select from a different year.Click Apply.